A chronological record of additions, changes and fixes made to Coda.
Where a change can be tried, Open example loads a working workflow in the editor.
The examples run on synthetic data in your browser, so they open without an account.
New since your last visit
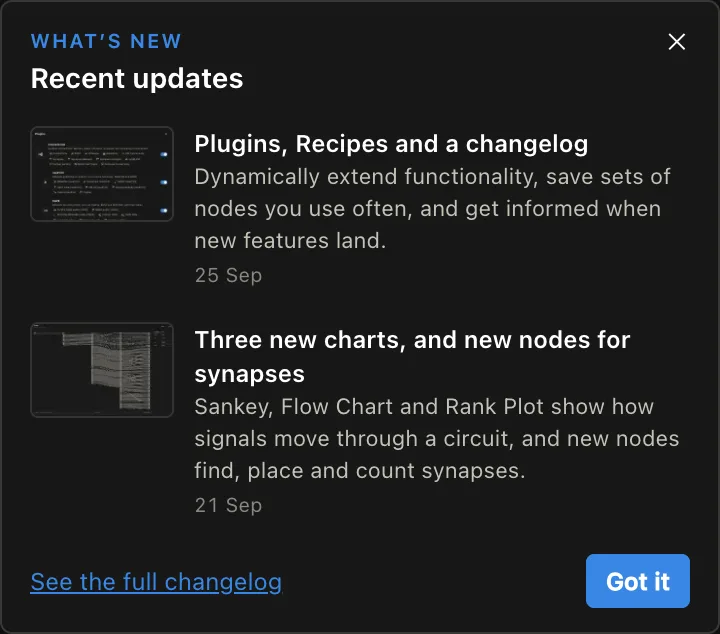
Plugins, Recipes and a changelog
Dynamically extend functionality, save sets of nodes you use often, and get informed when new features land.
Editor
Coda grew a Changelog
Chronologically list of all changes to Coda. Where a change can be tried, Open example loads a working workflow in the editor.
When a new feature drops, Coda shows a short note the next time you open it. You can find the note again under ? ▸ What’s New.
Editor
Plugins: making Coda modular
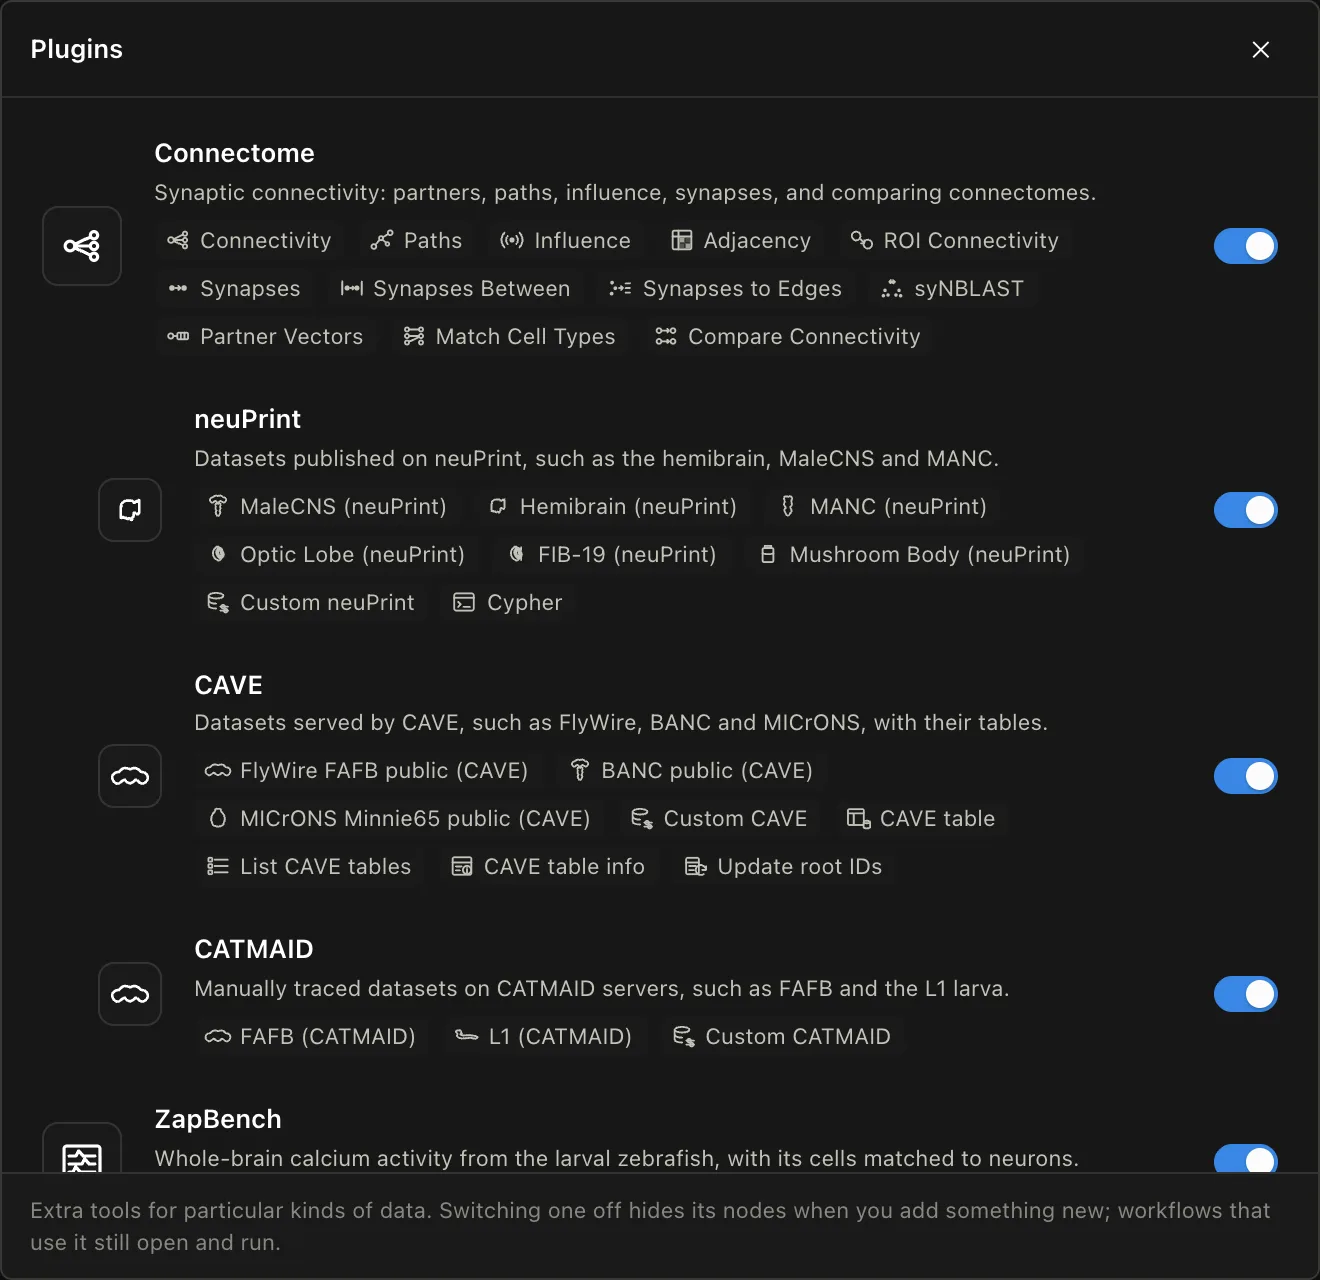
Nodes are now organised into plugins. The initial set includes Connectome, ZapBench and Cortex. Switch off the ones you don’t use under ⋯ ▸ Plugins. Workflows that already use them still open and run.
In the future, selecting sets of plugins will allow you to fully customise Coda to your specific needs.
The first new plugin is Cortex, with the Cortex Gallery for browsing MICrONS cells by type and cortical depth. Go to coda.science/cortex to open Coda with it switched on.
Select a set of nodes, right-click ▸ Save as Recipe…. The recipe can then be added to any workflow via the + button, the command palette or the context menu.
Data
FlyWire nodes warn about outdated cell types.
A FlyWire FAFB node on its own uses cell-type labels that have since been updated. The node now says so and offers a one-click fix that adds the current annotation tables.
Data
CAVE tables are easier to set up.
The CAVE table node’s settings are simpler, and CAVE neuron thumbnails load more reliably.
Data
MICrONS connectivity now uses an aggregated view.
Speeds up all connectivity queries.
Nodes
Improved CAVE node configuration.
Custom CAVE now lets you change the default synapse table and other settings.
Nodes
ROI Meshes works with numbered regions.
Sources that publish region IDs but no names can now be drawn.
3 fixes
The workflow list under Open now scrolls when it is long.
Hovering a CAVE table output now shows its contents.
The Recipes dialog handles a long list of recipes.
New since your last visit
Three new charts, and new nodes for synapses
Sankey, Flow Chart and Rank Plot show how signals move through a circuit, and new nodes find, place and count synapses.
Charts
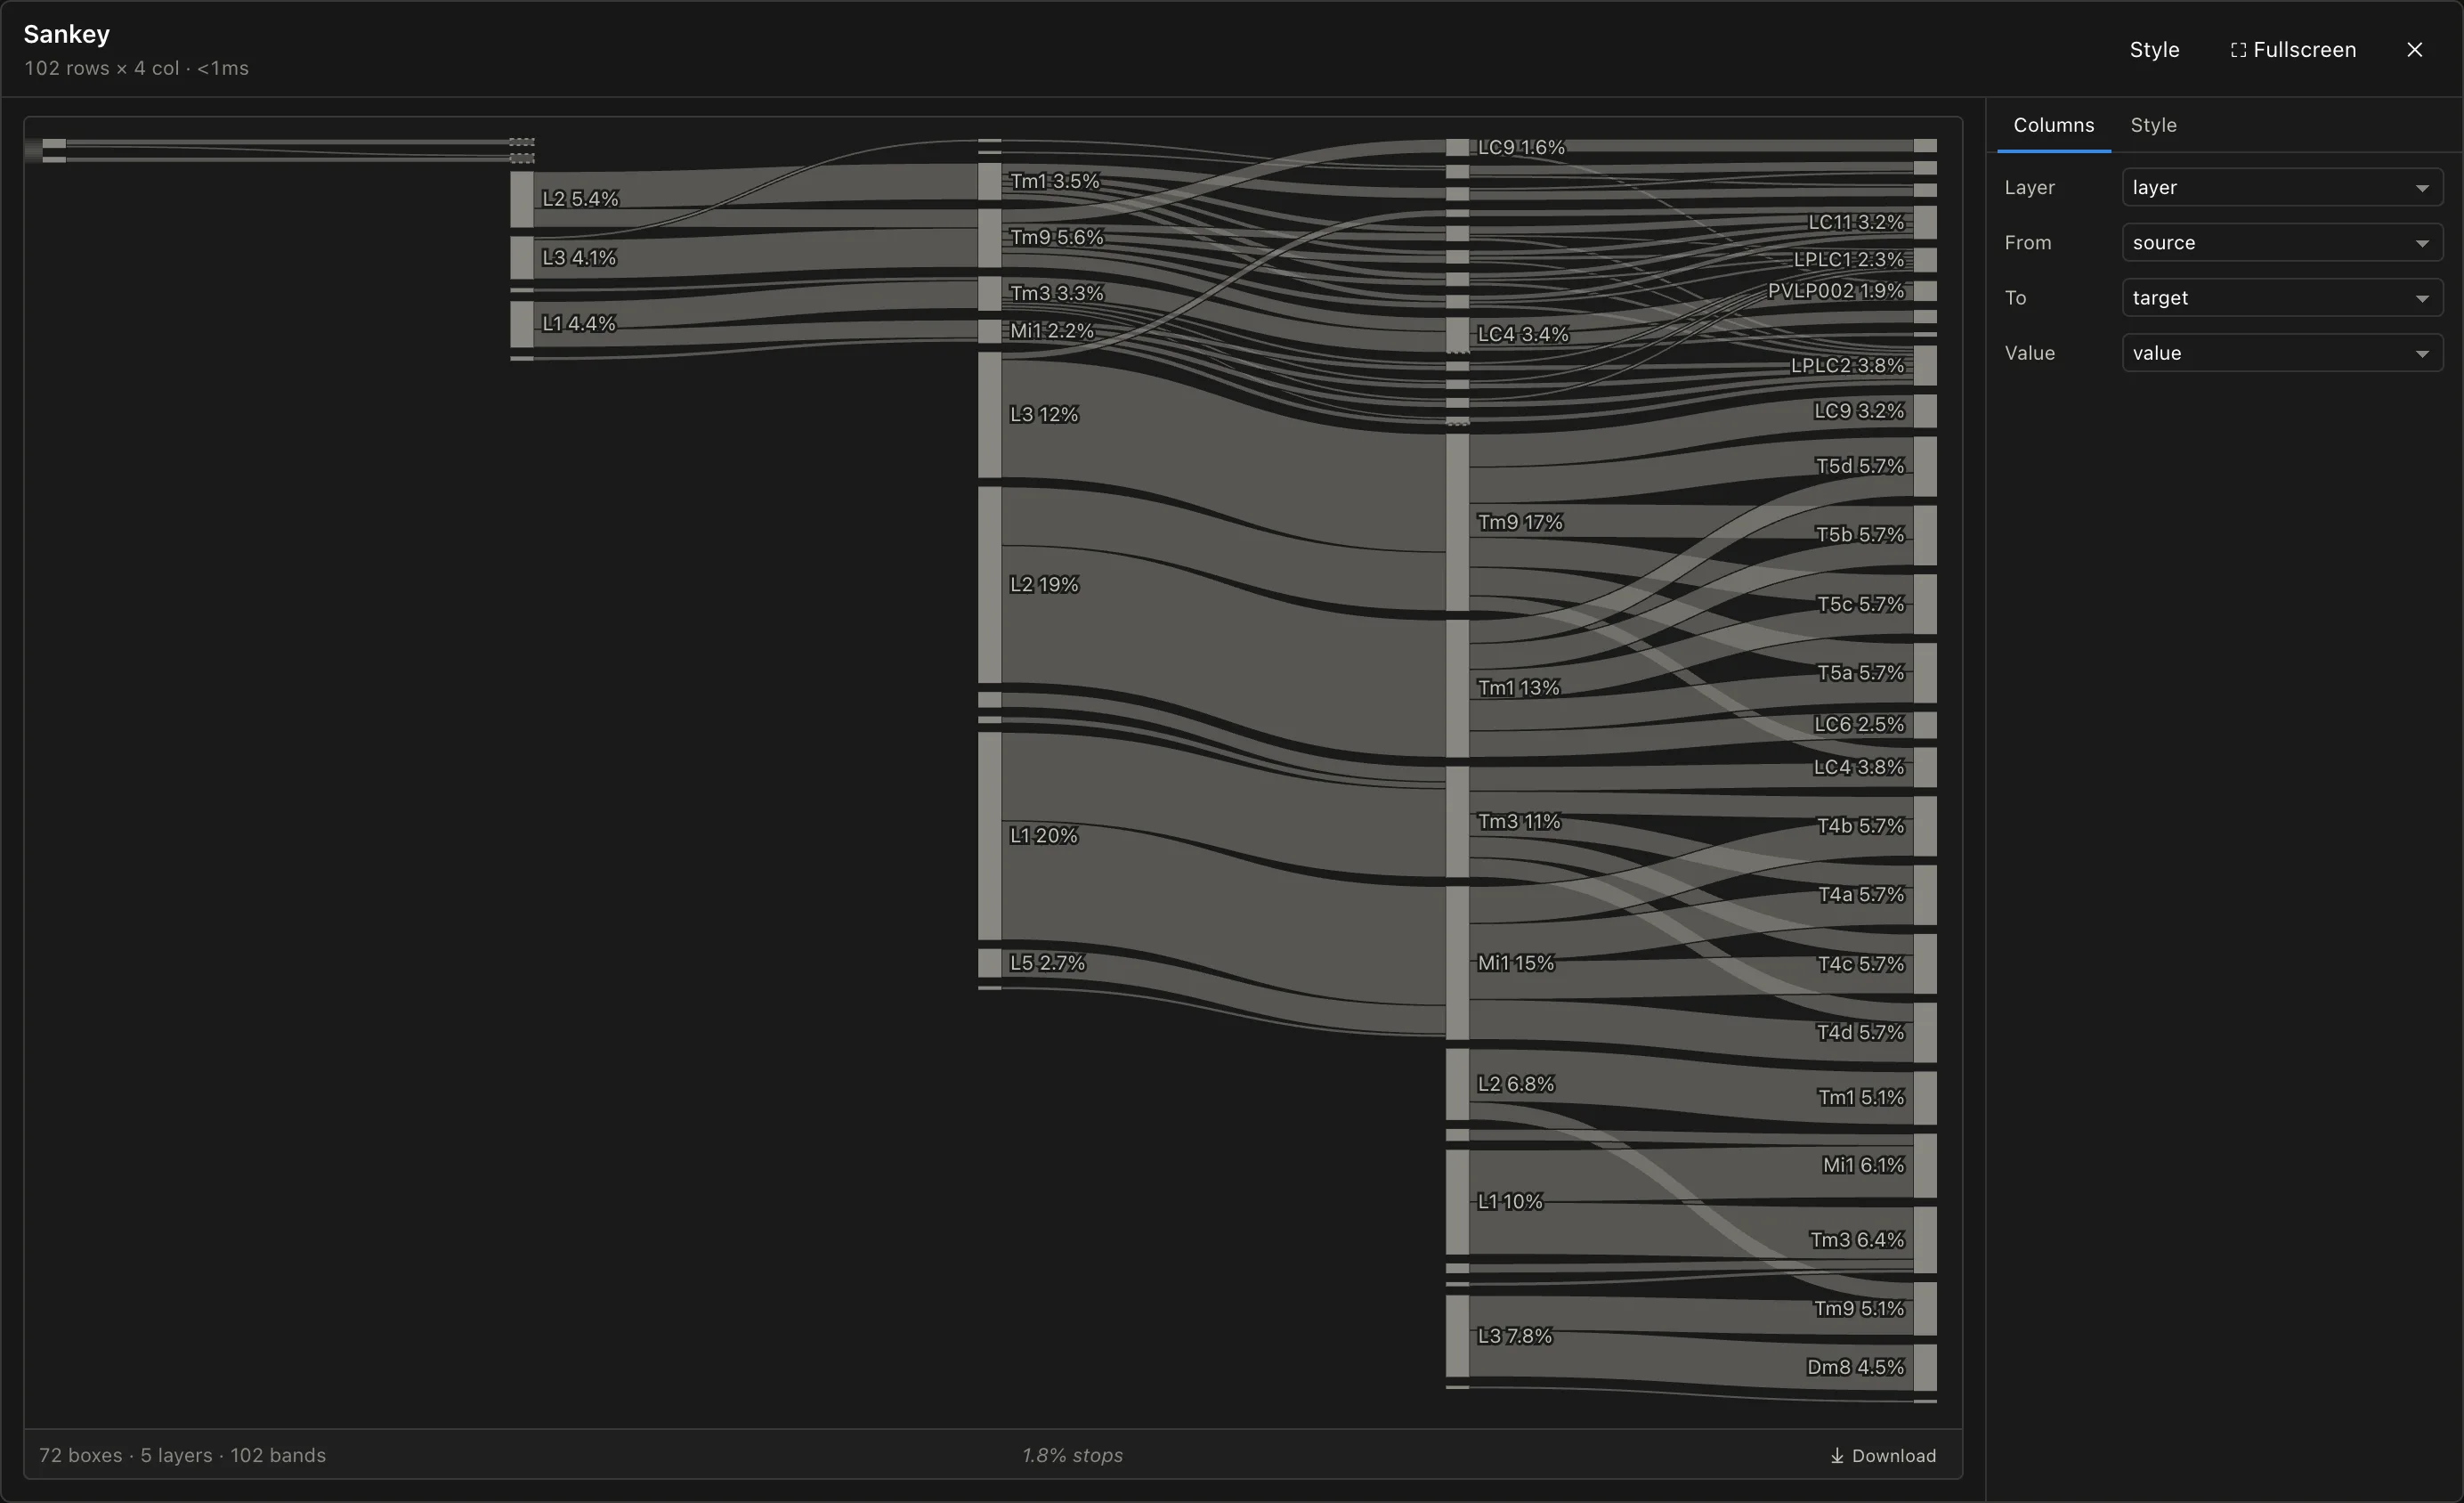
Sankey: where a signal goes, layer by layer
Connect an Influence node’s Transfers output and see how drive spreads from your seed neurons through each layer. The caption tells you how far the diagram is from conserving flow, because synapse counts usually don’t.
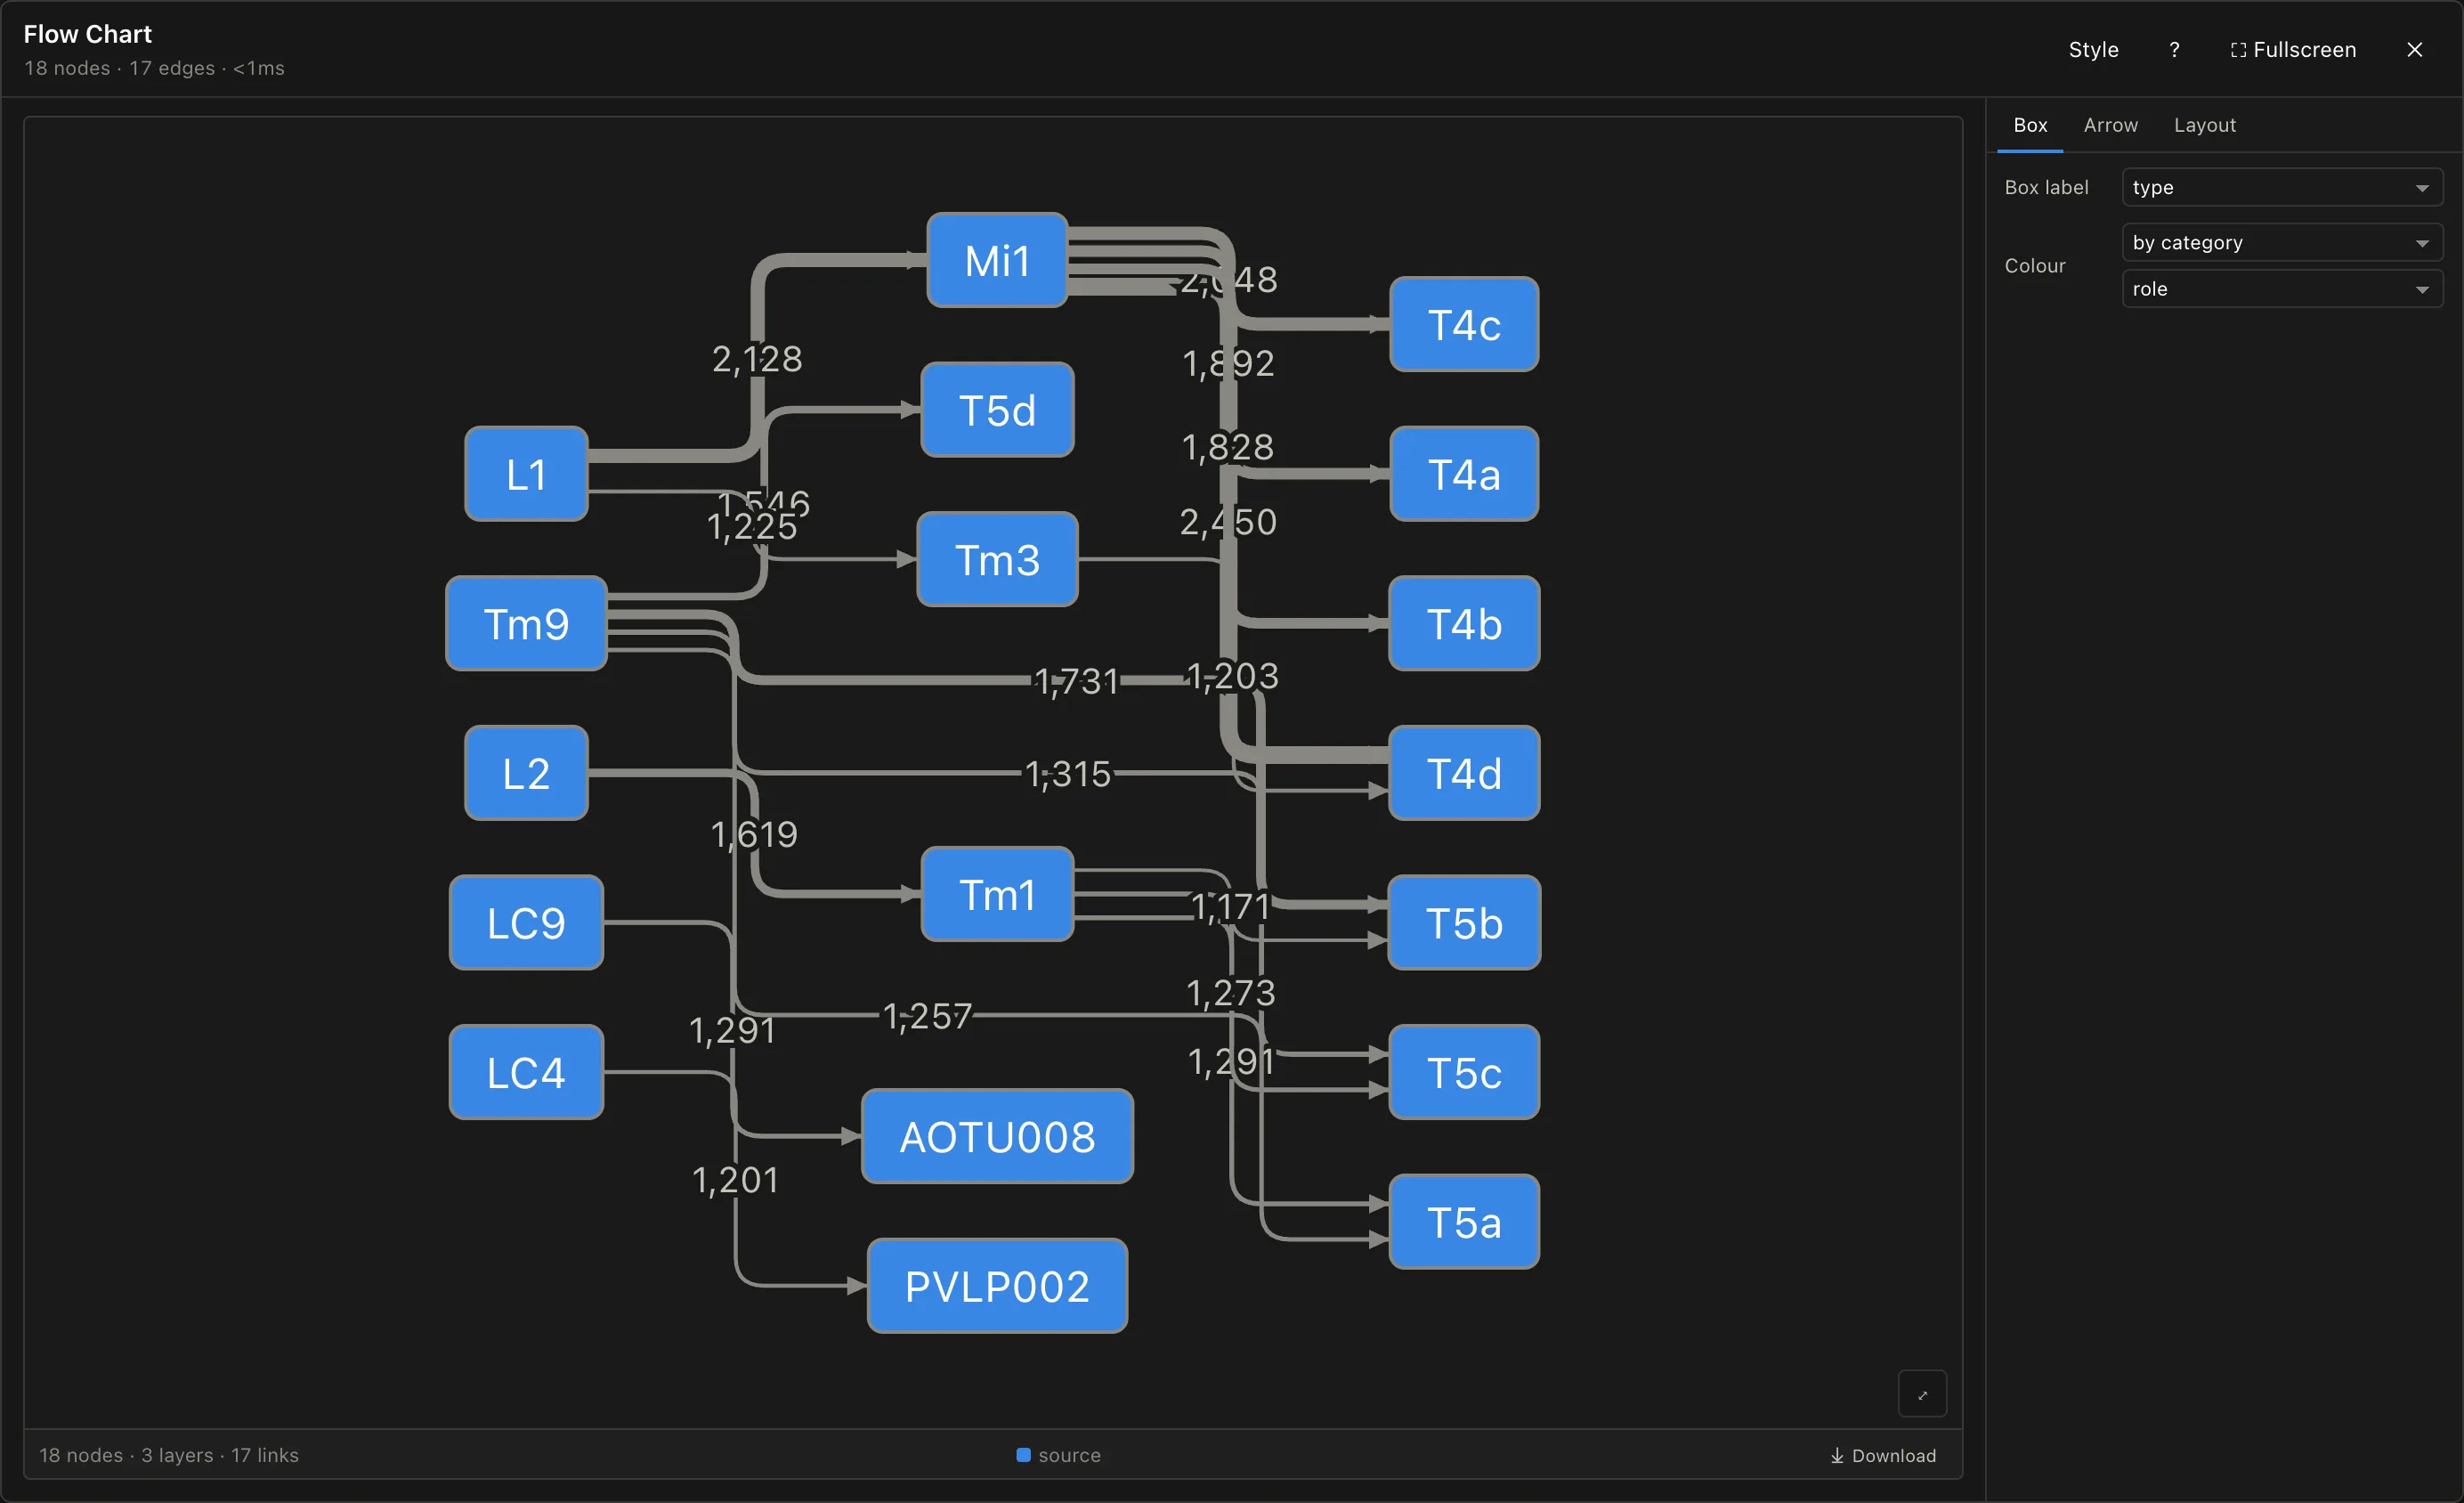
Boxes sized to their labels, arrows routed around them, and a synapse count on every arrow. Built for the tens of neurons a Paths search returns, where the Network Viewer is built for thousands. Feedback connections are drawn dashed so they are not mistaken for feed-forward ones.
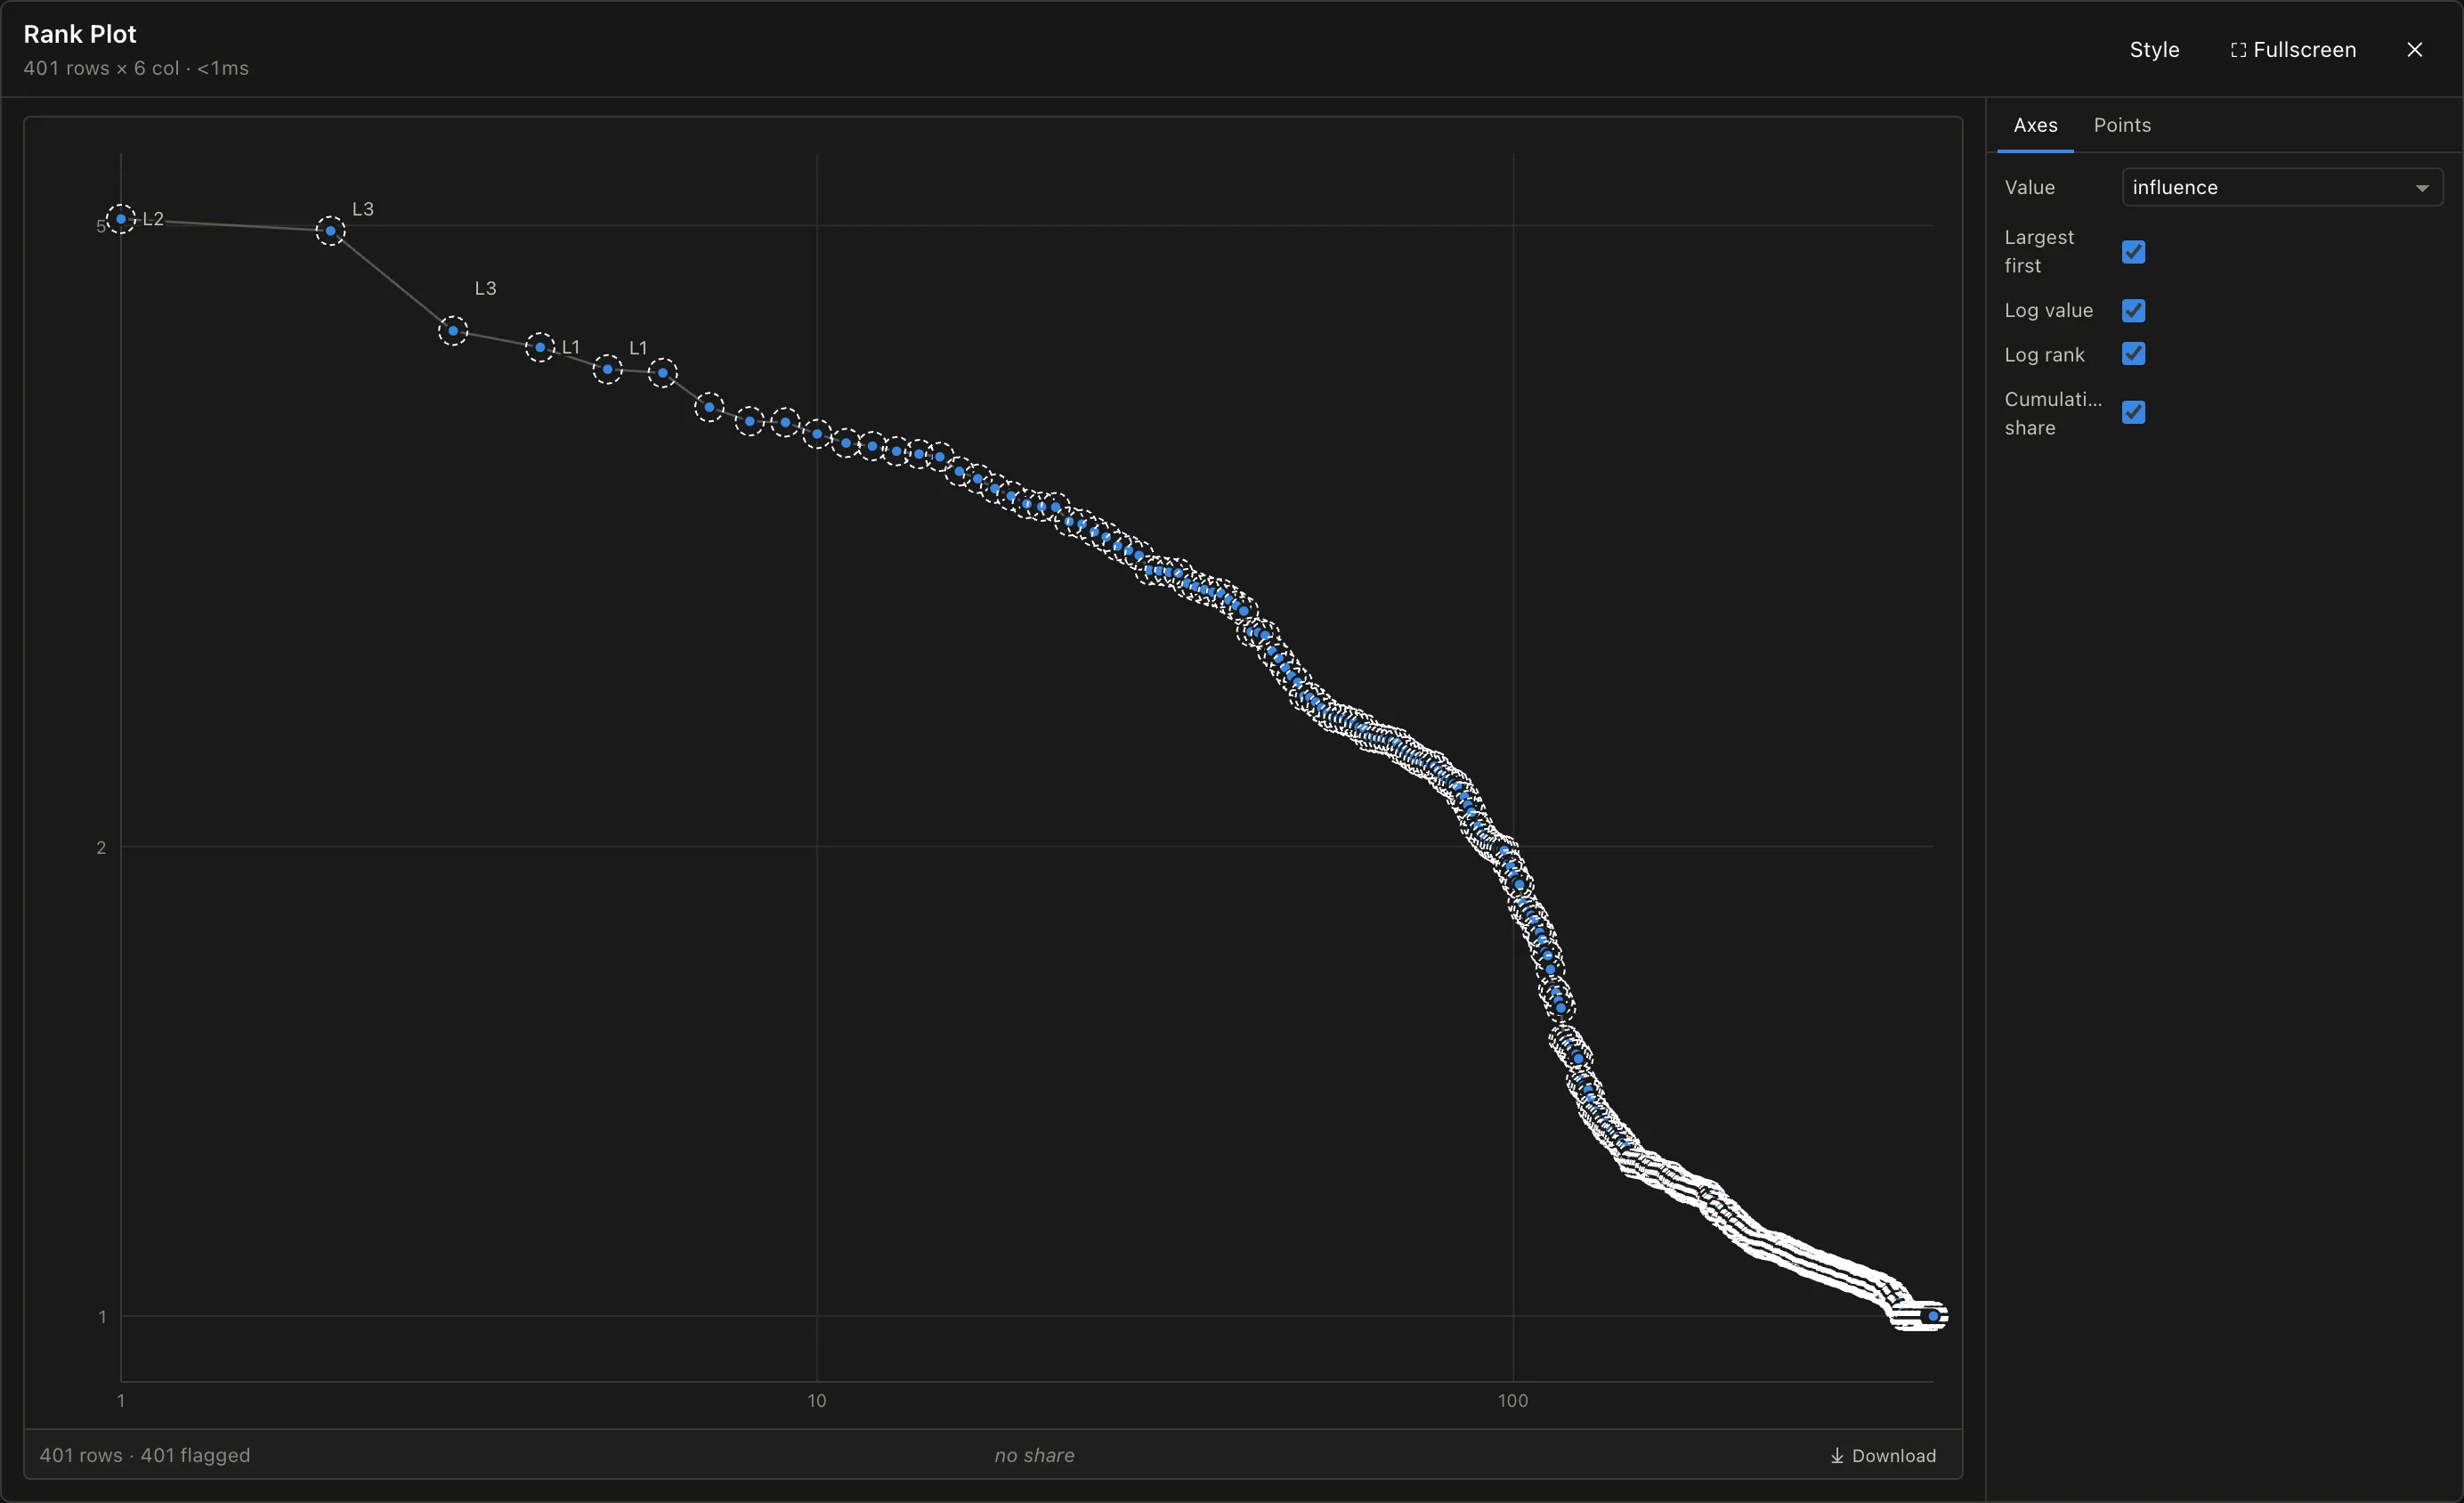
Scores on a log axis by rank, with the running share of the total underneath, so you can see how many neurons account for most of an influence score. Seed neurons are ringed and left out of the share.
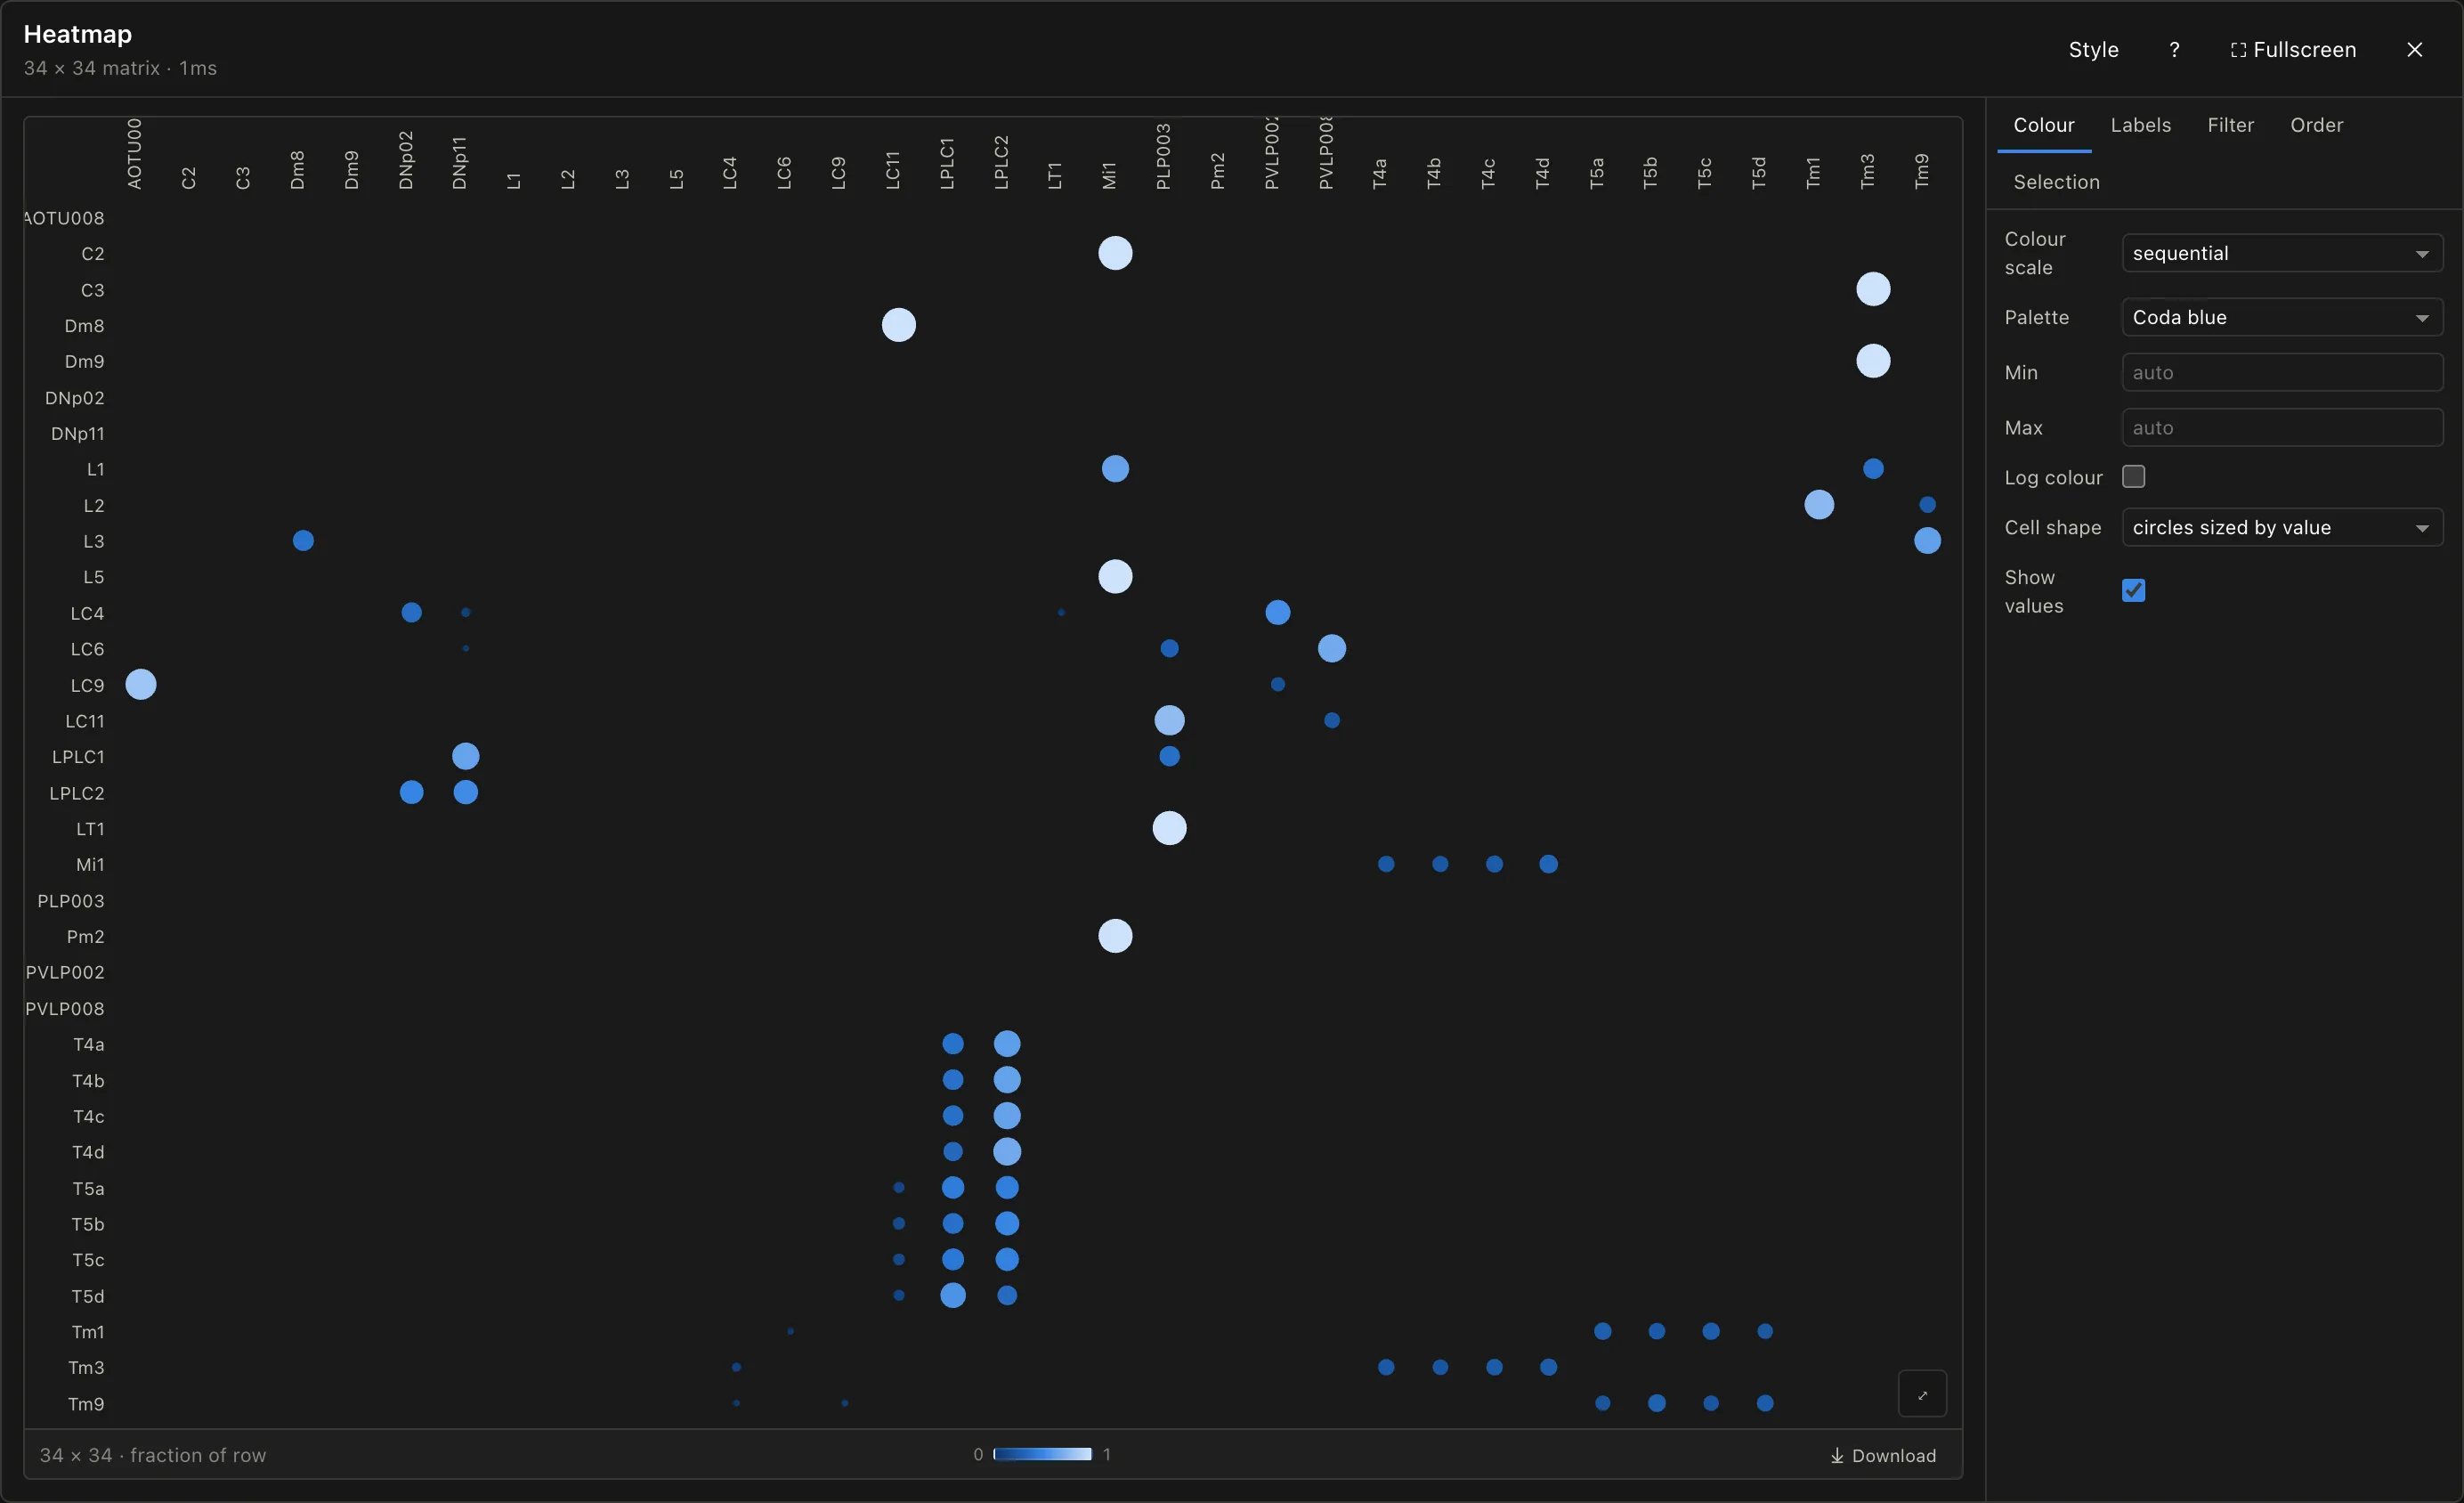
Set Cell shape to circles and each cell’s size shows its value as well as its colour. On a sparse matrix the pattern stands out, because empty cells stay blank.
Find the light-microscopy lines that match an EM neuron, using Janelia’s NeuronBridge index. You can also choose it as an analysis in the Workflow Wizard.
Nodes
New: Select Neurons.
Pick neurons out of a set by rules on their attributes. Open example →
Nodes
New nodes: Synapses Between and Synapses to Edges.
Get the synapses between two sets of neurons, then count them into an edge list, optionally split by region. Open example →
Nodes
New: Points in Volumes.
Label each synapse with the brain region, or any mesh, it sits inside. Open example →
Nodes
New: Distance between (preview).
The closest approach, mean or median distance between skeletons and meshes. Open example →
Nodes
New: Upload Mesh.
Bring your own OBJ, PLY or STL into the 3D View.
Data
Sign in to neuPrint from Coda.
A sign-in window replaces copying a token from the neuPrint website.
Data
Large meshes draw in Firefox.
Meshes also has an explicit Downsample setting. Full resolution is the default.
Nodes
Normalised weights.
Connection weights can be divided by each neuron’s total input or output, and Paths reports how many neurons each step covers.
Editor
Use Coda from your AI assistant.
The Coda MCP server lets Claude and other assistants build workflows for you and hand back a link that opens them.
Editor
Node descriptions on hover.
The node browser describes each node as you hover it, and warning messages across nodes are clearer.
5 fixes
Heatmap rows are ordered correctly when labels are supplied.
Graphene meshes load completely.
The NeuronBridge Download button is no longer clipped.
Explore Dataset lays out correctly when narrow.
ROI Meshes works with a Neuroglancer source as input.
New since your last visit
From zebrafish activity to connectivity
ZapBench calcium recordings can now be joined to connectome neurons, and the editor shows more about what is on each wire.
Data
New nodes: Cell IDs, ZapBench Traces, ZapBench to Neurons and Neurons to ZapBench Traces.
Read whole-brain calcium activity from the larval zebrafish, and go from its cells to connectome neurons and back.
Nodes
New: Embedding.
UMAP of a feature or similarity matrix, reproducible with a fixed seed. Open example →
Nodes
New nodes: Reduce Matrix and Attach Attributes.
Collapse a matrix to one value per row or column (mean, sum, spread), and add columns from a table to skeletons or meshes. Open example →
Editor
Hover an output to preview it.
After a run, hovering a node’s output socket shows what it holds: columns, a row, the size.
Editor
Hints on nodes.
Attach a short note to any node for whoever opens the workflow next.
Editor
Screen Map.
A new guide under ? ▸ Guides labels every control on screen at once.
Charts
Selecting in the 3D View.
Click a mesh to select it; unselected neurons fade. Skeletons are drawn at their real thickness.
Charts
Heatmap selection and labels.
Select rows and columns by dragging, and rename axis labels, for example from IDs to cell types.
Nodes
A richer Explore Dataset.
Animated thumbnails on hover, small distribution plots, and a guide for the expanded view.
Data
Other CAVE deployments.
Custom CAVE can point at any CAVE server, not only the public ones.
Charts
Network Viewer to Cytoscape.
Open the graph in Cytoscape Web with one click.
Editor
Memory readout.
The status bar shows how much memory Coda is using, and the top-left menu can Clone and Rename workflows.
Editor
Phones and small screens.
The toolbar folds into a menu instead of zooming the whole page out.
4 fixes
Very thin neurons now get a thumbnail in Explore Dataset.
Clearer error when a CAVE service is likely down.
Collapsed groups line up correctly.
Default point size in the 3D View.
New since your last visit
Compare connectomes from the Wizard
The Workflow Wizard can build one workflow over several datasets at once, and every node guide entry opens a working example.
Editor
Multi-dataset comparisons in the Workflow Wizard
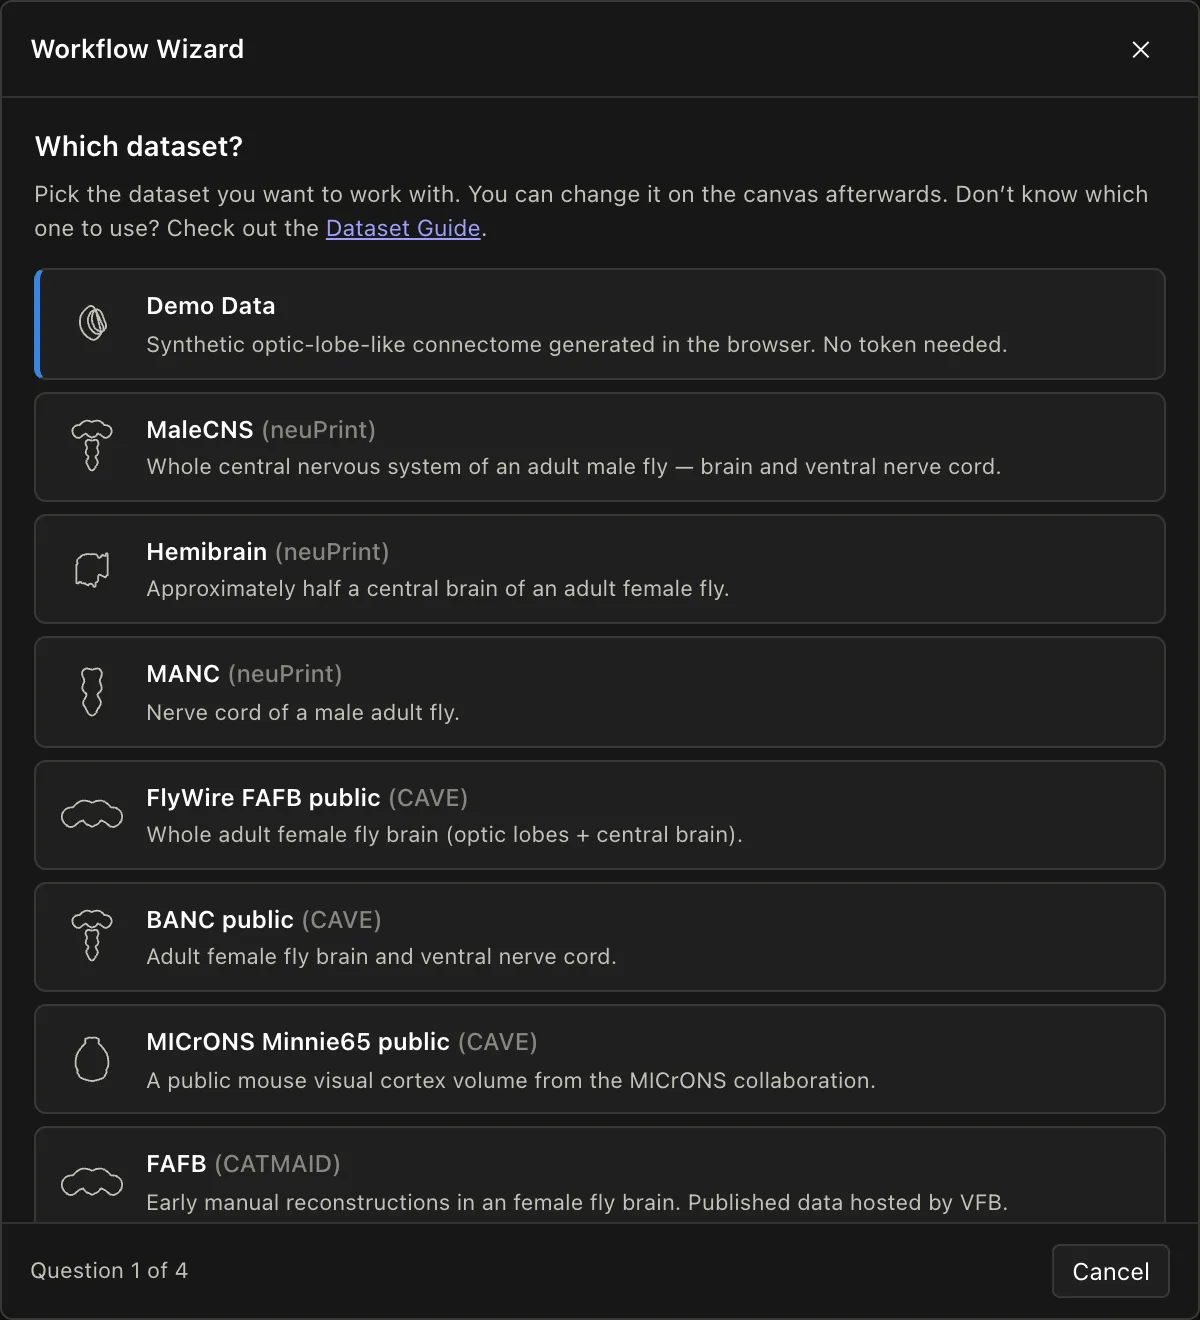
Choose two or more connectomes in the Wizard’s first question and it builds one workflow that stacks them, offering only the analyses every chosen dataset supports. Generated workflows are laid out automatically and carry a note explaining each step.
Also in this update
Nodes
New: Split Neurons.
Divide skeletons or meshes into two groups by a rule, with Carry fields to bring any column along. Open example →
Nodes
Stack Tables and Stack Neurons take any number of inputs.
Charts
Dendrogram zoom and labels.
Zoom and pan, and rename leaves from an annotation table. Open example →
Nodes
Neuron Profile groups by any column.
Including cell type, so a profile can describe a whole type rather than one neuron.
Editor
Examples in the Node Guide.
Every entry has Open in a workflow and a See also list.
Editor
Dashboard progress.
The Dashboard shows a progress bar while it runs, and ⌘A selects every node.
Editor
AI assistant modes.
A lean mode and a reasoning mode, and a Send run values switch for keeping results out of the conversation.
Changed
Find Neurons with no filter now returns no neurons.
It used to return the whole dataset, which could start a very large query as soon as the node was dropped on the canvas. Add a filter or a region to get neurons back. Saved workflows that relied on the old behaviour will show an empty table.
Changed
Neuron IDs are always text.
Every data source now publishes neuronId as text rather than a number. Long CAVE IDs no longer lose digits, and neuPrint and CAVE tables can be stacked together. If you export a table and join it elsewhere, the ID column type has changed.
6 fixes
Reloading while in the Dashboard no longer marks results as stale.
Right-clicking the selection rectangle opens the right menu.
Table from URL accepts GitHub file links.
Unlit synapses in Neuron Topology are drawn with the right transparency.
Collapsed groups show when a member is running or has failed.
Corrected descriptions for BANC and maleCNS.
New since your last visit
Coda is public
Coda opens to everyone as a public beta: a node-graph editor for connectome analysis that runs in your browser.
Editor
Connectome analysis, as a graph you can see
Wire nodes together to query a connectome, reshape the answer and draw it: partners, paths, influence, morphology and more, over neuPrint, CAVE and CATMAID datasets. Nothing to install; it runs in your browser.
New to it? The Workflow Wizard builds a first workflow from four questions, the field guide explains the ideas, and the node guide describes every node.